Background and Need
USACE planners, engineers, and practitioners need tools for holistically assessing stream structure, function, and dynamic processes. Existing approaches have often relied on species-specific habitat models that focus narrowly on single taxa and do not capture ecosystem-scale outcomes. At the same time, the Civil Works planning process (SMART Planning) imposes different modeling needs as projects progress, from rapid site screening with sparse data (1-3 months) through conceptual design (12-20 months) to final design and post-construction monitoring. There is no standardized, nationally applicable framework that scales assessment effort to project phase while keeping results comparable.
A review of 188 stream assessment methods in the U.S. found that most methods do not evaluate the full range of ecosystem functions, there is limited guidance on matching effort to project phase, and results are difficult to compare across methods, projects, and regions.
The Framework
Screening Tier
Goal: Provides a broad, watershed or landscape-scale snapshot. Identifies constraints, opportunities, and where additional effort may be needed.
Data sources: Desktop GIS, existing data review, limited site photos, and brief recon where available.
Effort: Minutes to hours.
Uses: Scoping and site screening.
Rapid Tier
Goal: Refines understanding of site conditions. Field evidence supports planning decisions and alternatives comparison.
Data sources: Focused field observations, many site photos, limited modeling or lab data, desktop GIS, existing data.
Effort: Hours to days.
Uses: Design, comparing alternatives.
Detailed Tier
Goal: Provides high confidence, site-specific data to support final design decisions and performance evaluation.
Data sources: Intensive field data collection, extensive modeling or laboratory analysis, site photos, desktop GIS, existing data.
Effort: Days to weeks.
Uses: Final design, post-construction monitoring, regional studies.
Effort, data needs, confidence
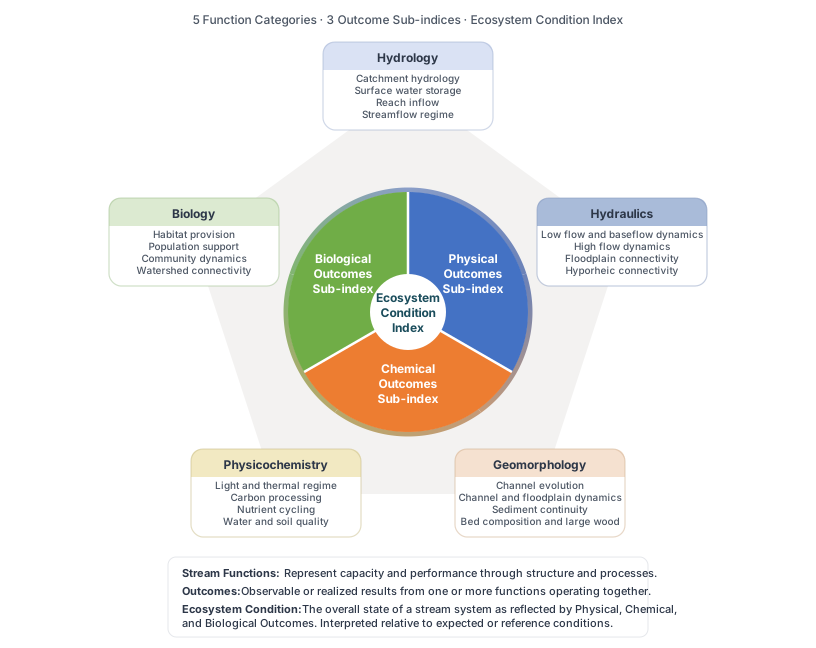
Common foundation: Stream functions are consistent across all tiers. The functions are comprehensive and broadly applicable to a wide range of streams.
Comparable results: Outcomes and Ecosystem Condition
Outcomes are observable or quantifiable results that are linked to how one or more stream functions operate.
Physical Outcomes
Physical outcomes are measurable results of hydrologic, hydraulic, geomorphic, and habitat-forming processes. They describe the physical structure of the stream and how water and sediment move through the system.
Examples: floodplain inundation frequency, channel stability, sediment transport balance, habitat unit distribution, substrate composition, and large wood abundance.
Chemical Outcomes
Chemical outcomes are measurable results of water chemistry and biogeochemical processes. They describe how chemical conditions support or limit aquatic life and ecosystem processes.
Examples: dissolved oxygen, nutrient concentrations, temperature regime, pH, contaminant levels, and organic matter decomposition rates.
Biological Outcomes
Biological outcomes are measurable characteristics of aquatic and riparian communities. They describe the presence, abundance, diversity, and functional roles of organisms in the system.
Examples: fish assemblage composition, macroinvertebrate diversity, species richness, presence of sensitive taxa, and functional feeding group distribution.
Ecosystem Condition
The overall state of a stream system, based on the combined performance of physical, chemical, and biological outcomes relative to expected or reference conditions. It indicates how well the system sustains ecological function and resilience over time.